
The cryptocurrency market is experiencing one of its most severe contractions of the year. Bitcoin (BTC) has plunged to the $61,000 level, triggering a massive wave of liquidations and dragging the broader digital asset ecosystem deep into the red. Just months after hitting all-time highs above $120,000, the world’s dominant digital asset has lost nearly half its value, erasing gains achieved during the post-election rally of late 2024.
This dramatic unwinding is not an isolated event. It is a compounding crisis driven by a perfect storm of macroeconomic pressures, unprecedented institutional outflows, systemic leverage failures, and shifting corporate strategies.
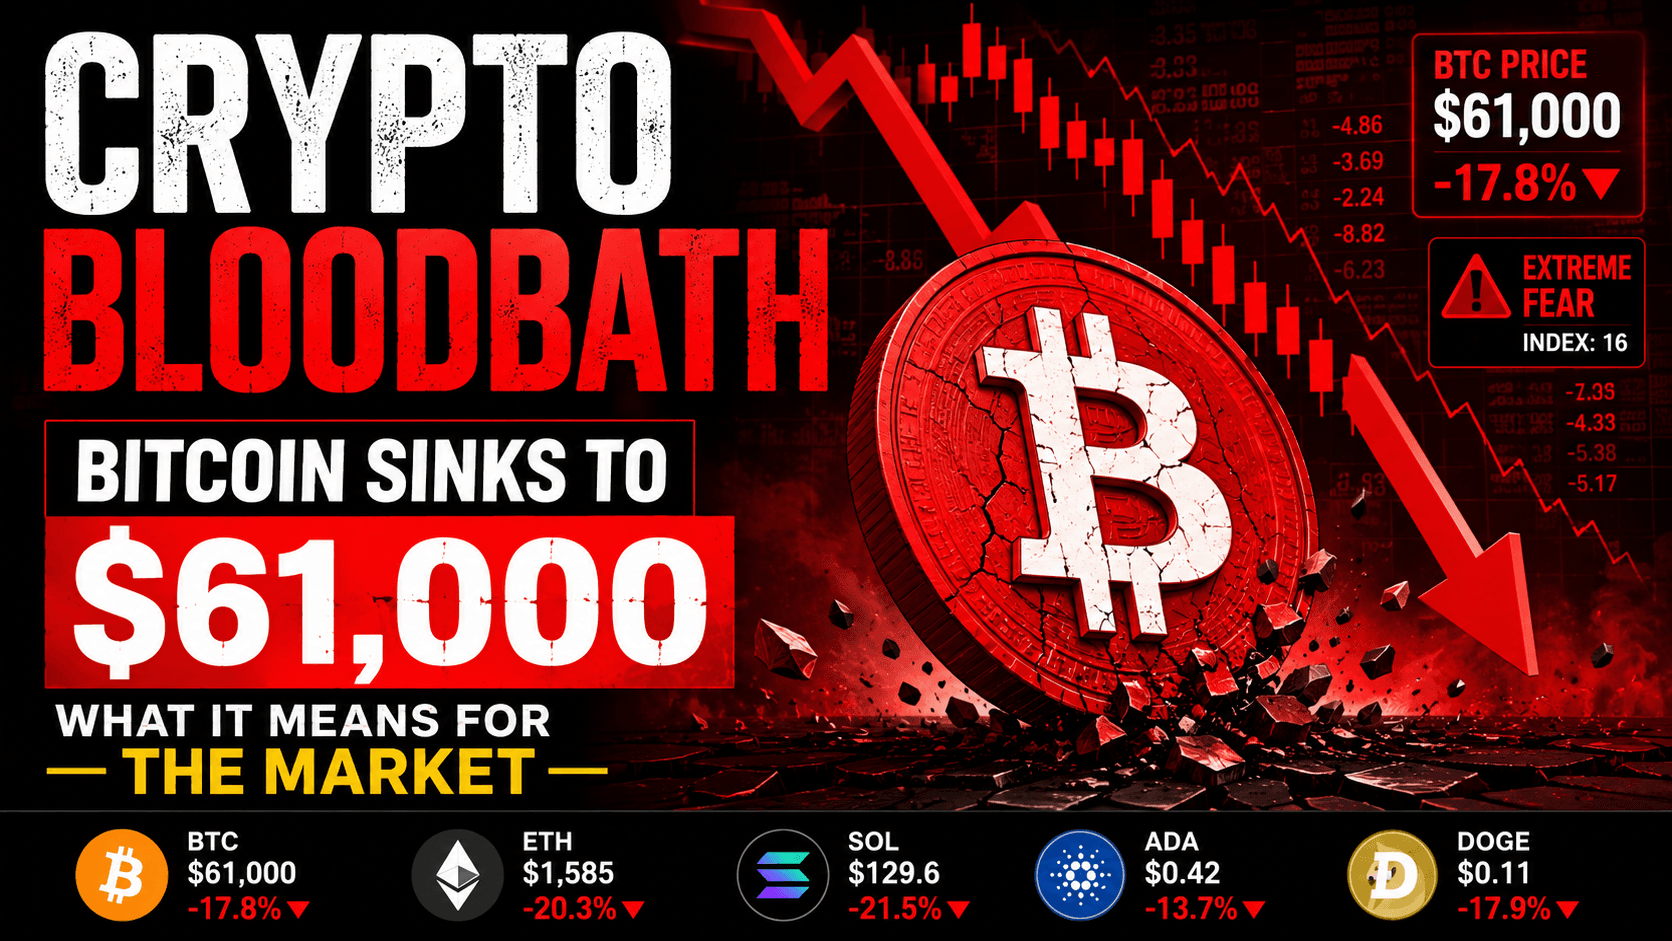
Inside the Numbers: The Scale of the Selloff
Bitcoin Sunk to $61,000: Key Reasons Behind the Crash
The velocity of the crash has left traders reeling. As Bitcoin broke through critical psychological and technical support levels, the cascading effects across the entire asset class became immediately apparent.
Massive Cascading Liquidations
When Bitcoin broke below the pivotal $70,000 mark and rapidly decelerated toward $61,000, it triggered a catastrophic leverage flush. Over a multi-day period, the crypto derivatives market witnessed the liquidation of nearly $7 billion worth of leveraged positions, with long positions accounting for over $5.7 billion of those losses.
On a single heightened day of trading, the system saw over $1.6 billion in forced liquidations within a 24-hour window. These forced closures created a feedback loop: falling prices triggered automatic margin calls, which forced exchange engines to market-sell collateral, driving prices down even further.
Broad Market Cap Eradication
The downturn wiped out roughly $390 billion to $600 billion in total market capitalization from the global digital asset ecosystem in a matter of days. The total crypto market cap now hovers precariously just above the $2.11 trillion mark, a stark contrast to the euphoric heights seen at the turn of the year. Reflecting this widespread panic, the Crypto Fear & Greed Index plummeted into “Extreme Fear,” tapping a dismal reading of 16.
The Core Drivers Behind the Crash
To understand if this is a temporary correction or the beginning of a prolonged crypto winter, it is essential to dissect the structural factors driving the current price action.
1. Macroeconomic Reality and the “Higher-for-Longer” Fed
For months, crypto proponents argued that institutional adoption via spot ETFs would decouple digital assets from traditional macroeconomic cycles. Recent weeks have soundly disproven this thesis.
A string of highly robust U.S. labor and economic data has effectively dashed investor expectations for immediate Federal Reserve rate cuts. With inflation proving sticky and the U.S. economy showing resilience, the central bank is poised to maintain restrictive, higher interest rates for longer than the market anticipated.
This macroeconomic environment favors yield-bearing cash instruments and short-term U.S. Treasury bills over high-risk, non-yielding speculative assets like Bitcoin and tech equities. As a result, capital is flowing out of risk assets and back into the safety of traditional fiat-based returns.
2. Record Institutional ETF Outflows
The launch of U.S. spot Bitcoin ETFs was the primary engine behind Bitcoin’s massive rally to six figures. However, that same institutional pipeline is now working in reverse.
Spot Bitcoin ETFs are currently enduring their longest and most severe outflow streak on record. Over consecutive trading sessions, these funds have consistently bled tens of millions of dollars daily. By removing the steady baseline of institutional buying demand that supported prices early in the year, the market has been left highly vulnerable to aggressive spot selling.
3. Corporate Strategy Reversals
Sentiment took an unexpected psychological hit following a major regulatory filing disclosure from MicroStrategy, historically the world’s largest and most fiercely committed corporate holder of Bitcoin. The firm disclosed that it had broken its multi-year accumulation streak to execute its first Bitcoin sale since late 2022.
While the transaction represented only a microscopic fraction of the company’s total multi-billion-dollar treasury, the symbolic shift deeply rattled retail and institutional confidence. It sparked intense market anxiety that one of crypto’s biggest “perma-bulls” might be adjusting its long-term exposure strategy in response to tighter economic conditions.
Altcoins Face an Even Deeper Rout
As is historically typical during major market corrections, alternative cryptocurrencies (altcoins) have suffered far greater percentage losses than Bitcoin, as investors scramble to consolidate capital into safer assets.
| Digital Asset | Weekly Decline | Key Technical Context |
|---|---|---|
| Bitcoin (BTC) | ~17% – 18% | Struggling to defend the critical $60,000 psychological baseline. |
| Ethereum (ETH) | ~20% – 21% | Plunged sharply below the $1,600 support level. |
| Solana (SOL) | ~21.5% | Erased significant ecosystem growth gains from the past quarter. |
| Cardano (ADA) | ~13.7% | Testing multi-month lows amid broader decentralized finance (DeFi) stagnation. |
| Dogecoin (DOGE) | ~17.9% | Heavily hit by the unwinding of speculative retail leverage. |
Smaller, less liquid digital assets are experiencing even harsher conditions. Broad small-cap digital asset indexes report annualized drops of roughly 70%, reflecting a comprehensive institutional exit from highly speculative altcoin ecosystems.
The Technical Outlook: Will the $60,000 Support Hold?
From a purely technical analysis perspective, all eyes are locked on the $60,000 threshold. During the depths of the overnight selloff, Bitcoin briefly dipped to a low of $59,840 before aggressive buyers stepped in to reclaim the $61,000 level in Asian trading sessions.
  Price Level ($)
       |
120K --+====================== (All-Time Highs)
       |                      \
       |                       \
       |                        \
 70K --+-------------------------\---- (Previous Support Broken)
       |                          \
 61K --+---------------------------\--- CURRENT TRADING ZONE
 60K --+............................*.. CRITICAL PSYCHOLOGICAL LINE
       |
       +---------------------------------------------
                                   Time (2026)
Market analysts point to the options market as an indicator of intermediate-term sentiment. Open interest clusters heavily around the $60,000 put options, indicating that traders are buying defensive insurance policies to protect against a structural breakdown.
If Bitcoin establishes a clean, daily candle close below $60,000, technical charts indicate a lack of strong historical volume support until the $50,000 to $52,000 territory. Conversely, if institutional outflows stabilize and the upcoming Federal Open Market Committee (FOMC) meetings offer a more dovish outlook on monetary policy, this correction may mirror historical patterns as an aggressive, healthy shakeout of over-leveraged traders.
Conclusion: A Critical Crossroads for Digital Gold
The current digital asset rout serves as a stark reminder that Bitcoin continues to behave fundamentally as a volatile risk asset, rather than an unassailable macro hedge or “digital gold”. When global liquidity tightens and capital conditions constrict, institutional players treat crypto as a liquidity spigot to de-risk broader financial portfolios.
For long-term believers, multi-year market downturns of this scale have historically presented accumulation opportunities. However, for high-leverage retail participants, the sudden plunge to $61,000 is an aggressive warning of the underlying risks inherent to an evolving, highly financialized crypto market. The coming weeks will determine whether $60,000 marks a resilient floor or the gateway to a much deeper macroeconomic revaluation.
view Last news https://www.coindesk.com/markets/2026/06/06/bitcoin-back-above-usd61-000-after-rout-leads-to-usd1-6-billion-liquidations
learning morehttps://khaldir.com/2026/06/05/how-to-start-affiliate-marketing-in-2026/